Operating the LIDAR
The Lidar Class
The lidar class should encapsulate all the essential operations required for lidar operation. In particular, the class should provide a method that provides a point representation that accurately depicts the environment.
import serial
import time

class Lidar:
    def __init__(self):
        #self.PORT = "/dev/ttyUSB0"
        self.PORT = "COM13"
        self.BAUDRATE = 460800
        self.serial =  serial.Serial(self.PORT, self.BAUDRATE, timeout=1)

    def send_cmd(self, cmd):
        self.serial.write(cmd)
        time.sleep(0.05)

    def start_scan(self):
        self.send_cmd(b'\xA5\x20')

    def stop_scan(self):
        self.send_cmd(b'\xA5\x25')

    def reset(self):
        self.send_cmd(b'\xA5\x40')

    def close(self):
        self.serial.close()

    # get_scan_packet  ---
    # get one tupel for : angle , distance, quality
    def get_scan_packet(self):
        while True:
            b0 = self.serial.read(1)
            if not b0:
                return None
            b0 = b0[0]

            # echtes RPLIDAR Sync-Kriterium
            if ((b0 & 0x01) ^ ((b0 >> 1) & 0x01)) == 1:
                rest = self.serial.read(4)
                if len(rest) != 4:
                    return None

                b1, b2, b3, b4 = rest

                quality = b0 >> 2

                angle_raw = ((b1 >> 1) | (b2 << 7))
                angle = angle_raw / 64.0

                dist_raw = b3 | (b4 << 8)
                distance = dist_raw / 4.0

                if 0 <= angle <= 360 and 10 <= distance <= 8000:
                    return angle, distance, quality

    # get_full_scan ------
    # scan until you have num_points; num_points should not be too small
    # to get a good scan
    def get_full_scan(self, num_points):
        frame = []
        while len(frame) < num_points:
            pkt = self.get_scan_packet()
            if not pkt:
                continue
            angle, distance, quality = pkt
            frame.append((angle, distance, quality))
        return frame
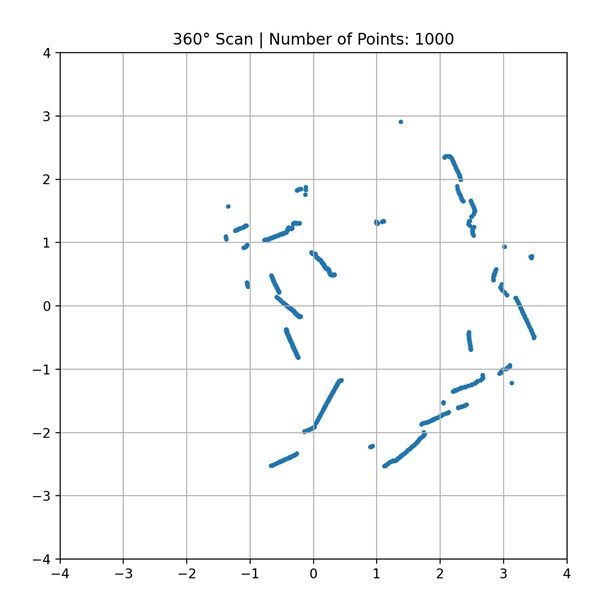
Visualization
This program serves as a test for the lidar class by displaying the collected data in a coordinate system.
import time
import math
import matplotlib.pyplot as plt
from Lidar import Lidar

# --- Plot one Frame (angle and distance) ---
def plot_frame(frame, sc, ax):
    xs = []
    ys = []

    for angle, distance, _ in frame: # quality will not be displayed
        r = distance / 1000.0  # convert from mm to m
        rad = math.radians(angle)
        x = r * math.cos(rad)
        y = r * math.sin(rad)
        xs.append(x)
        ys.append(y)

    sc.set_offsets(list(zip(xs, ys)))
    ax.set_title(f"360° Scan | Number of Points: {len(frame)}")

# --- Main ---
def main():
    ldr = Lidar()
    ldr.reset()
    time.sleep(2)
    ldr.start_scan()

    plt.ion()
    fig, ax = plt.subplots(figsize=(7,7))
    sc = ax.scatter([], [], s=6)
    ax.set_aspect('equal')
    ax.set_xlim(-4, 4)
    ax.set_ylim(-4, 4)
    ax.set_title("LiDAR 360° Scan")
    ax.grid(True)
    try:
        while True:
            # make a scan with 1000 points
            frame = ldr.get_full_scan(1000)
            plot_frame(frame, sc, ax)
            plt.pause(0.001)
            time.sleep(1)

    except KeyboardInterrupt:
        print("\nStop Scan...")
    finally:
        ldr.stop_scan()
        ldr.close()
        plt.ioff()
        plt.show()

if __name__ == "__main__":
    main()
The result of acan should look like this example: